Organizations
Each organization’s data and users are kept separate.
Connect your machines, monitor operations, understand production and predict problems from a single industrial platform.
assets/promonitor/dashboard-overview.webp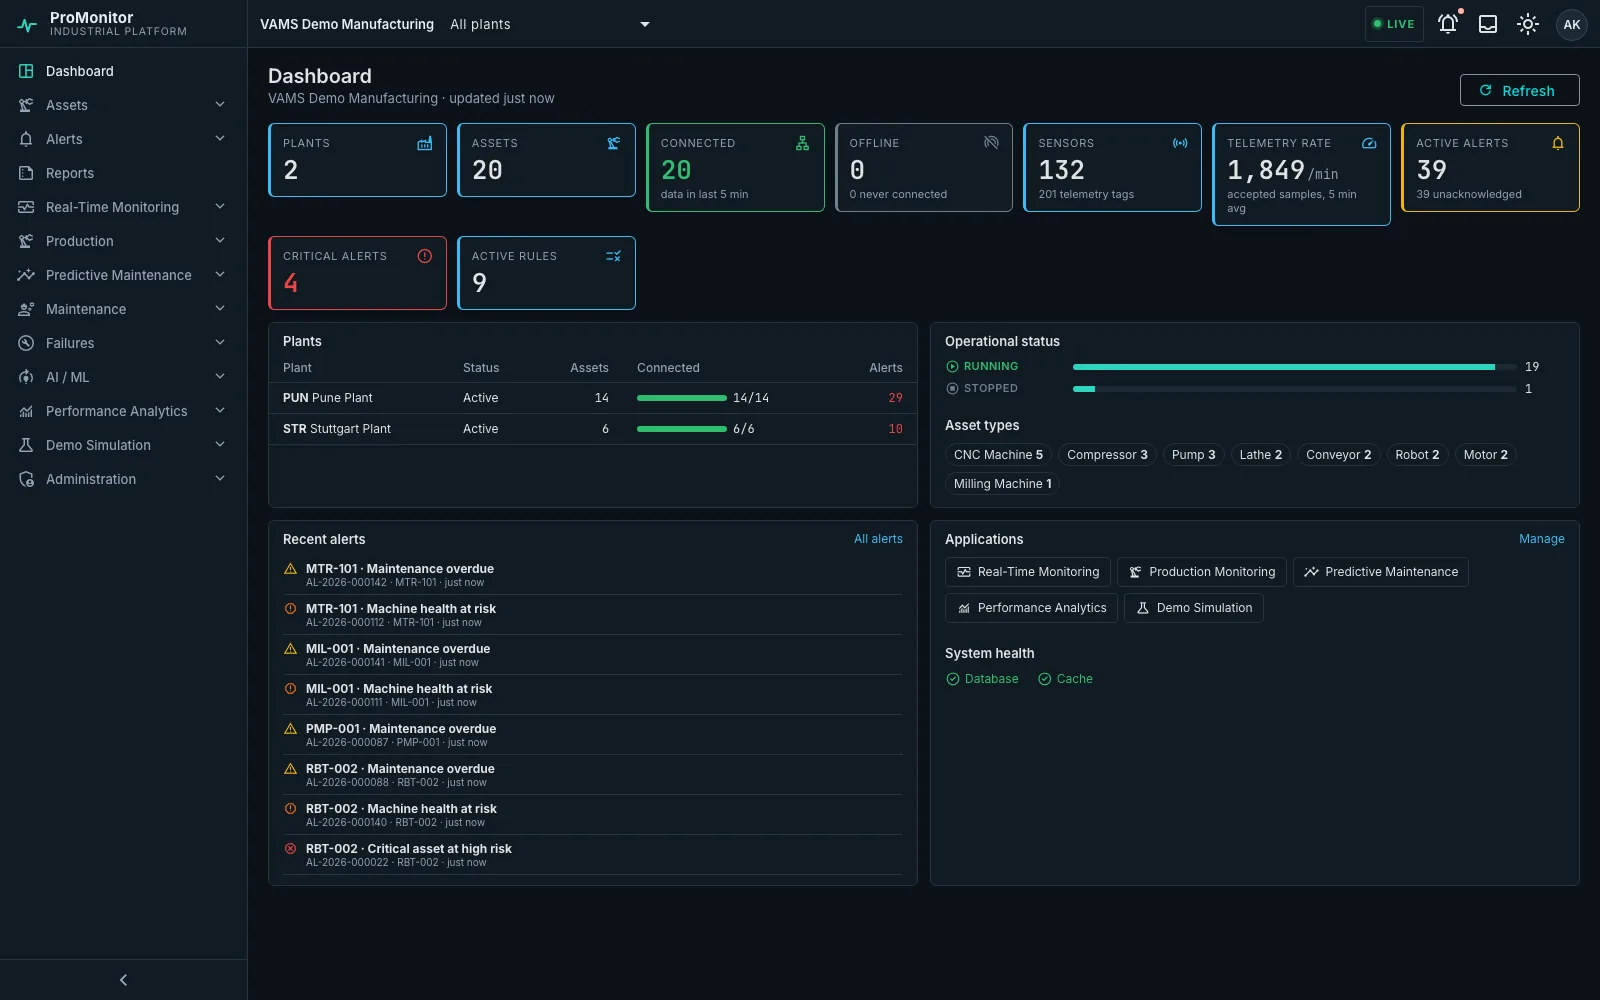
ProMonitor is a modular industrial software platform developed by VAMS Mechatronica. A common core connects to industrial equipment, stores machine data and manages assets, users, alerts and events. Applications built on that core then answer specific questions: what the machines are doing, what is being produced, and what is likely to fail.
It is a software product, not a consulting service or a single dashboard — VAMS Mechatronica also provides the industrial automation and integration work that connects it to your factory.
Data flows through five stages. Each one is a separate layer of the platform.
Assets · Telemetry · Events · Alerts · Rules · Users
Real-Time Monitoring · Production Monitoring · Predictive Maintenance
Visibility · Reliability · Productivity · Better decisions
Each protocol is a driver in the ProMonitor connectivity agent, so machines from different vendors end up in the same asset model and the same data pipeline.
The core holds everything that is common to every application, so each new application starts from the same connected assets and data.
Each organization’s data and users are kept separate.
Sign-in with tokens, role-based permissions, and per-application access.
Plants, shifts, areas, lines, machines, components and sensors in one hierarchy.
Tags with scaling, state mapping and quality; time-series storage and a latest-value cache.
A common log of what happened to each asset, and when.
Devices with encrypted credentials and drivers for OPC UA, Modbus TCP, MQTT, MTConnect, FOCAS and Siemens.
Rules that raise alerts, with notifications and acknowledgement.
An audit log with CSV export, and a shared reporting service.
Available today, and what is planned.
“What is every machine doing right now, and what just happened?”
Explore Real-Time Monitoring Available“What are we supposed to produce, what are we producing, what remains, what is late?”
Explore Production Monitoring Available“What is happening with my machine, what will happen next, and what should I do?”
Explore Predictive MaintenancePerformance Analytics — OEE and energy views built on the same core data.
Planned, and not yet available:
Screens from a ProMonitor demonstration environment that uses simulated machine data. Select a screen to enlarge it.
assets/promonitor/monitoring-overview.webp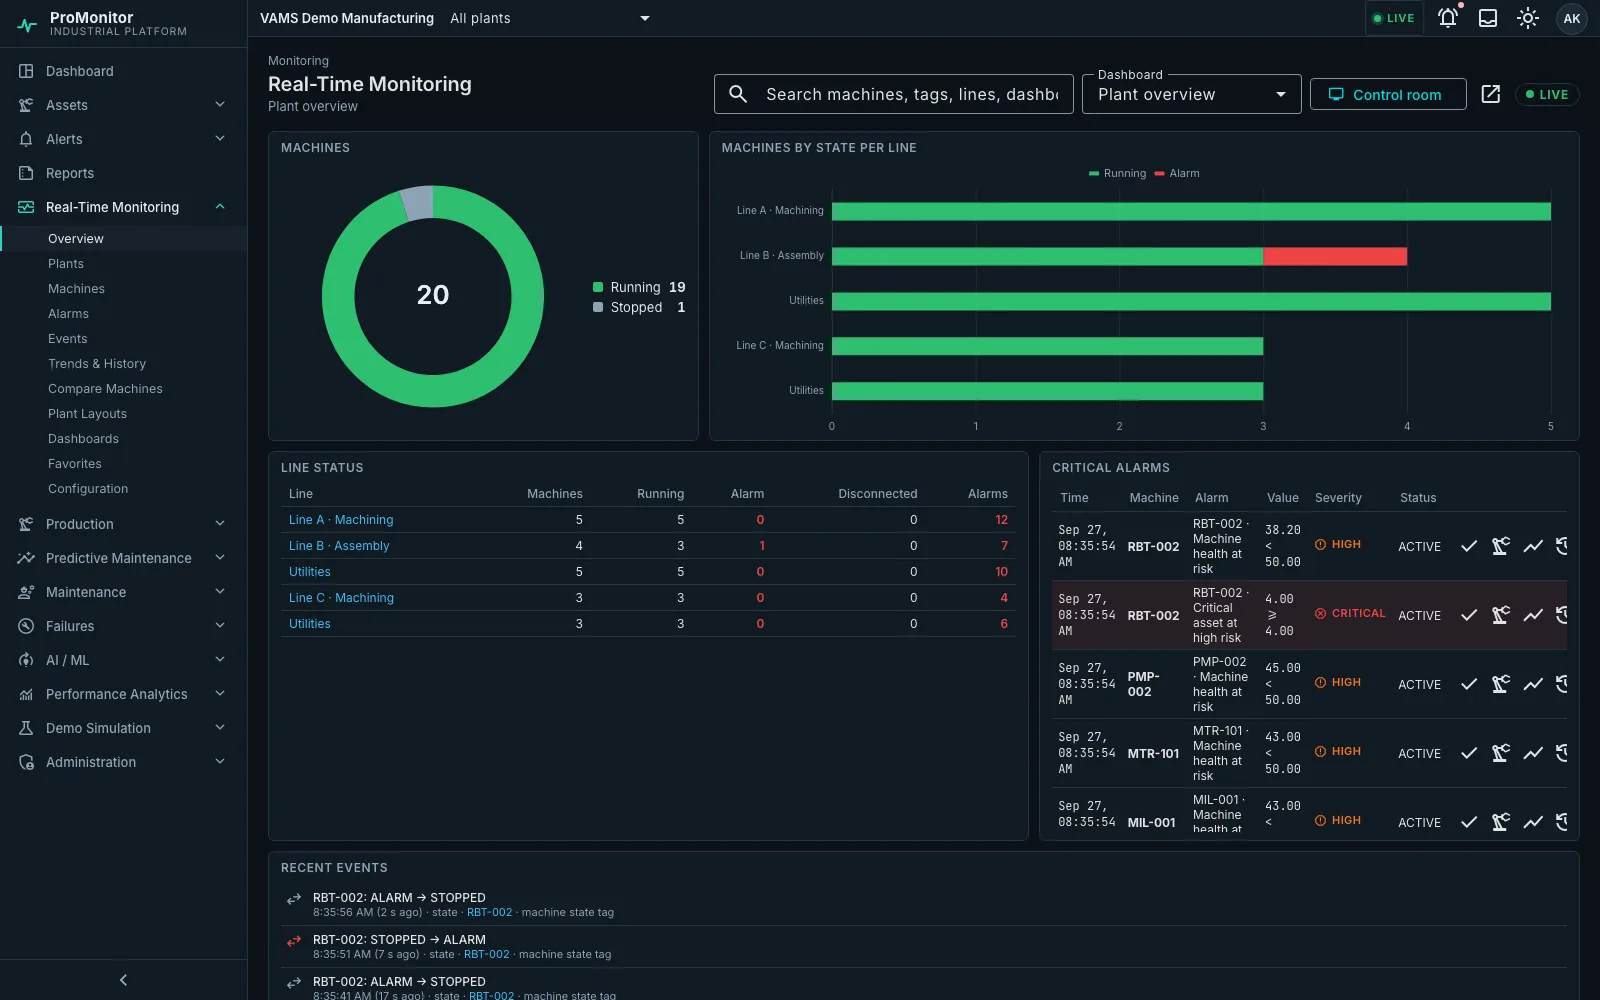
assets/promonitor/monitoring-machine.webp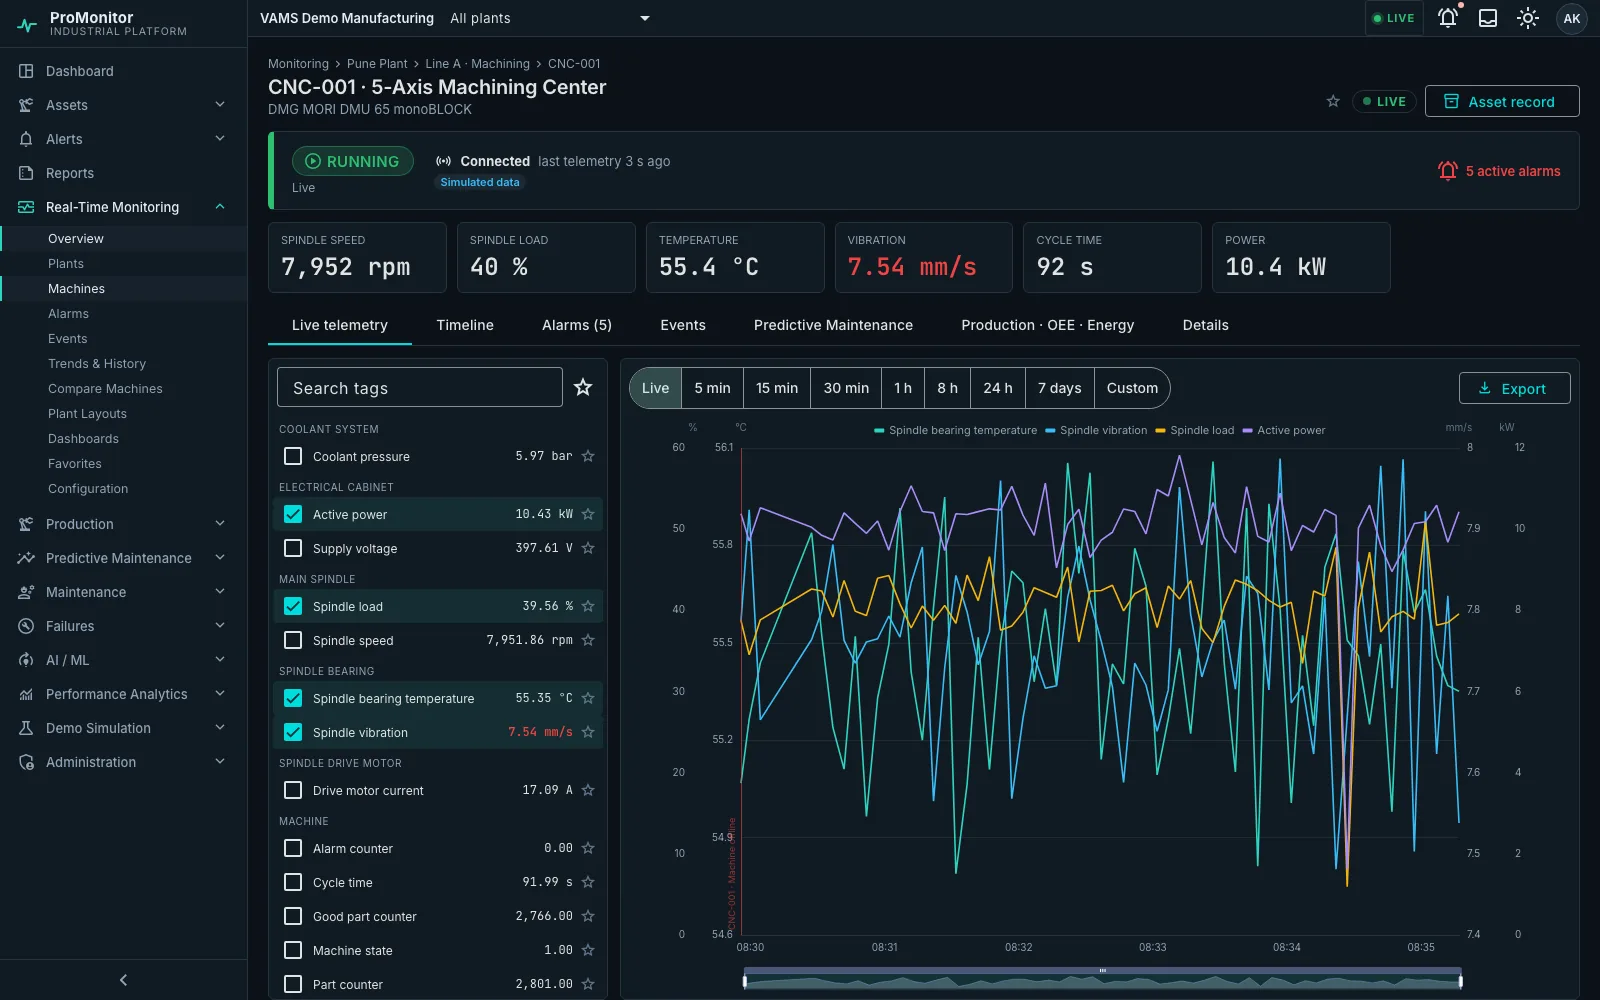
assets/promonitor/monitoring-alarms.webp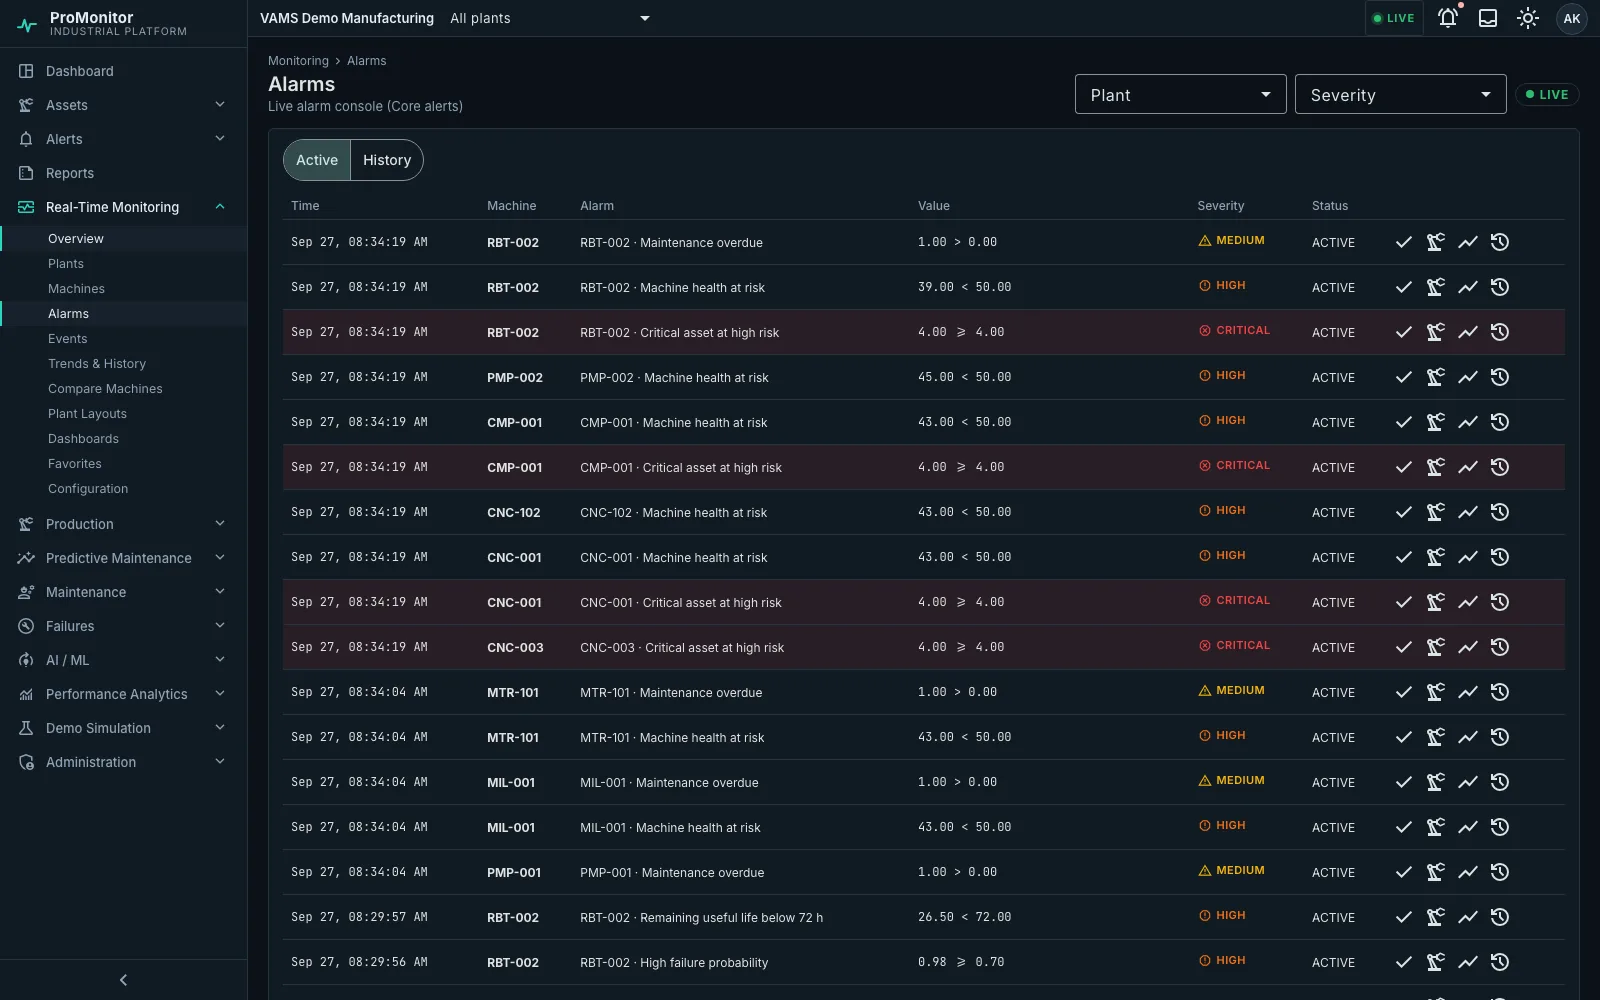
assets/promonitor/pdm-overview.webp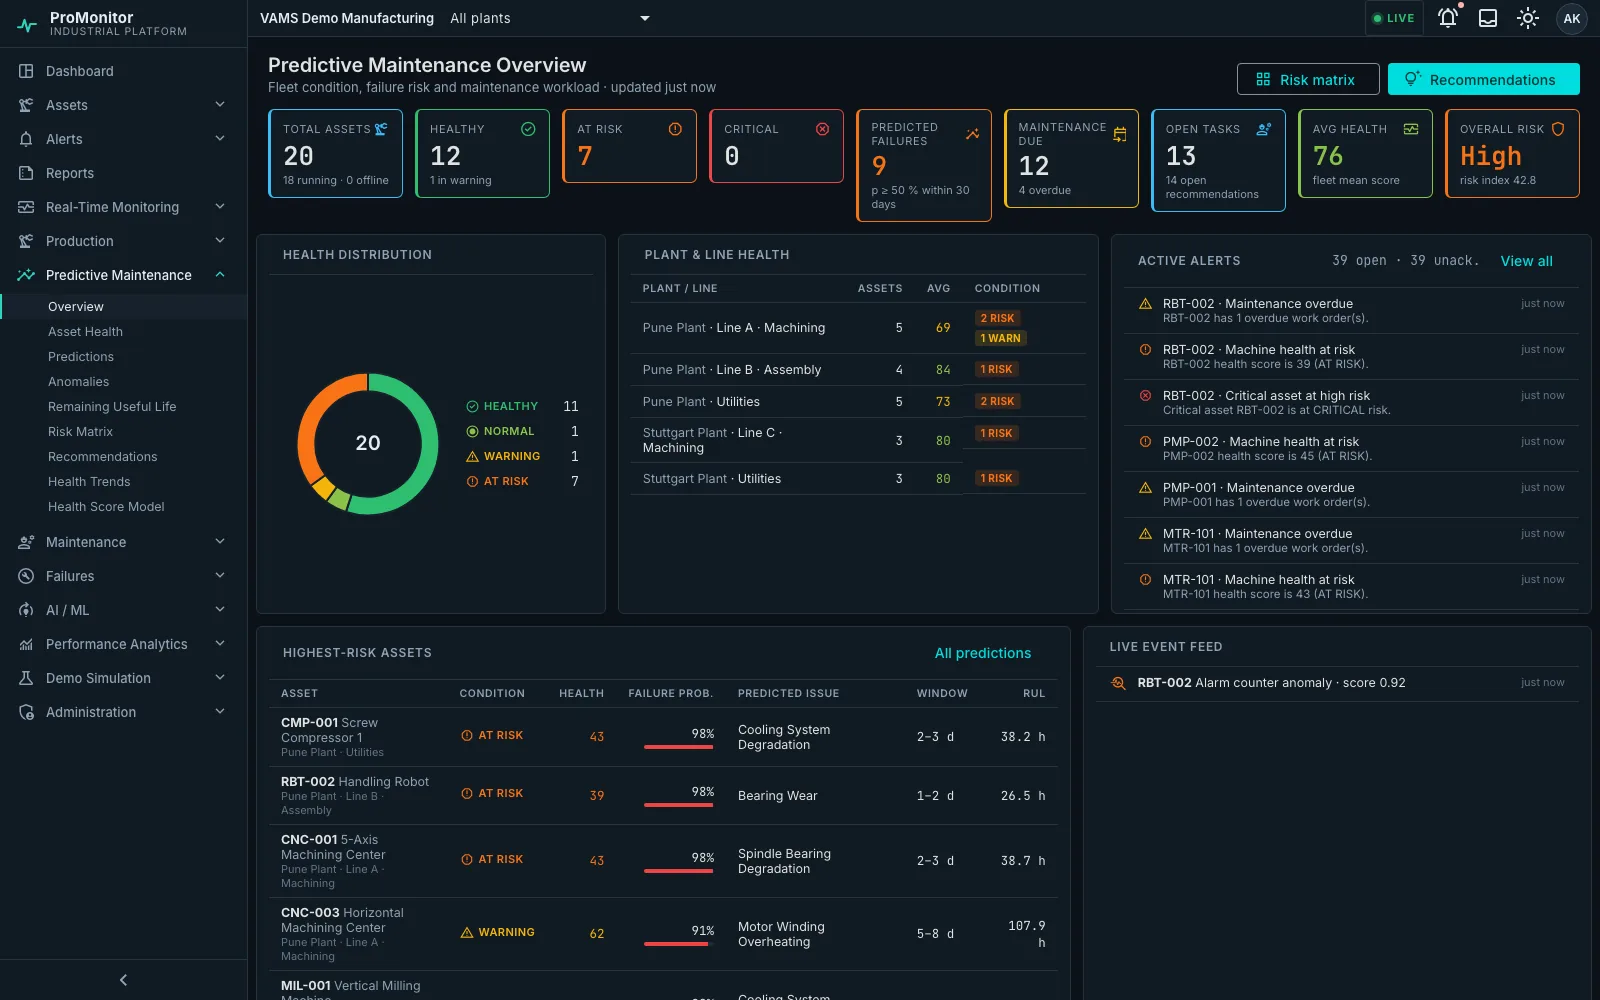
assets/promonitor/pdm-asset-health.webp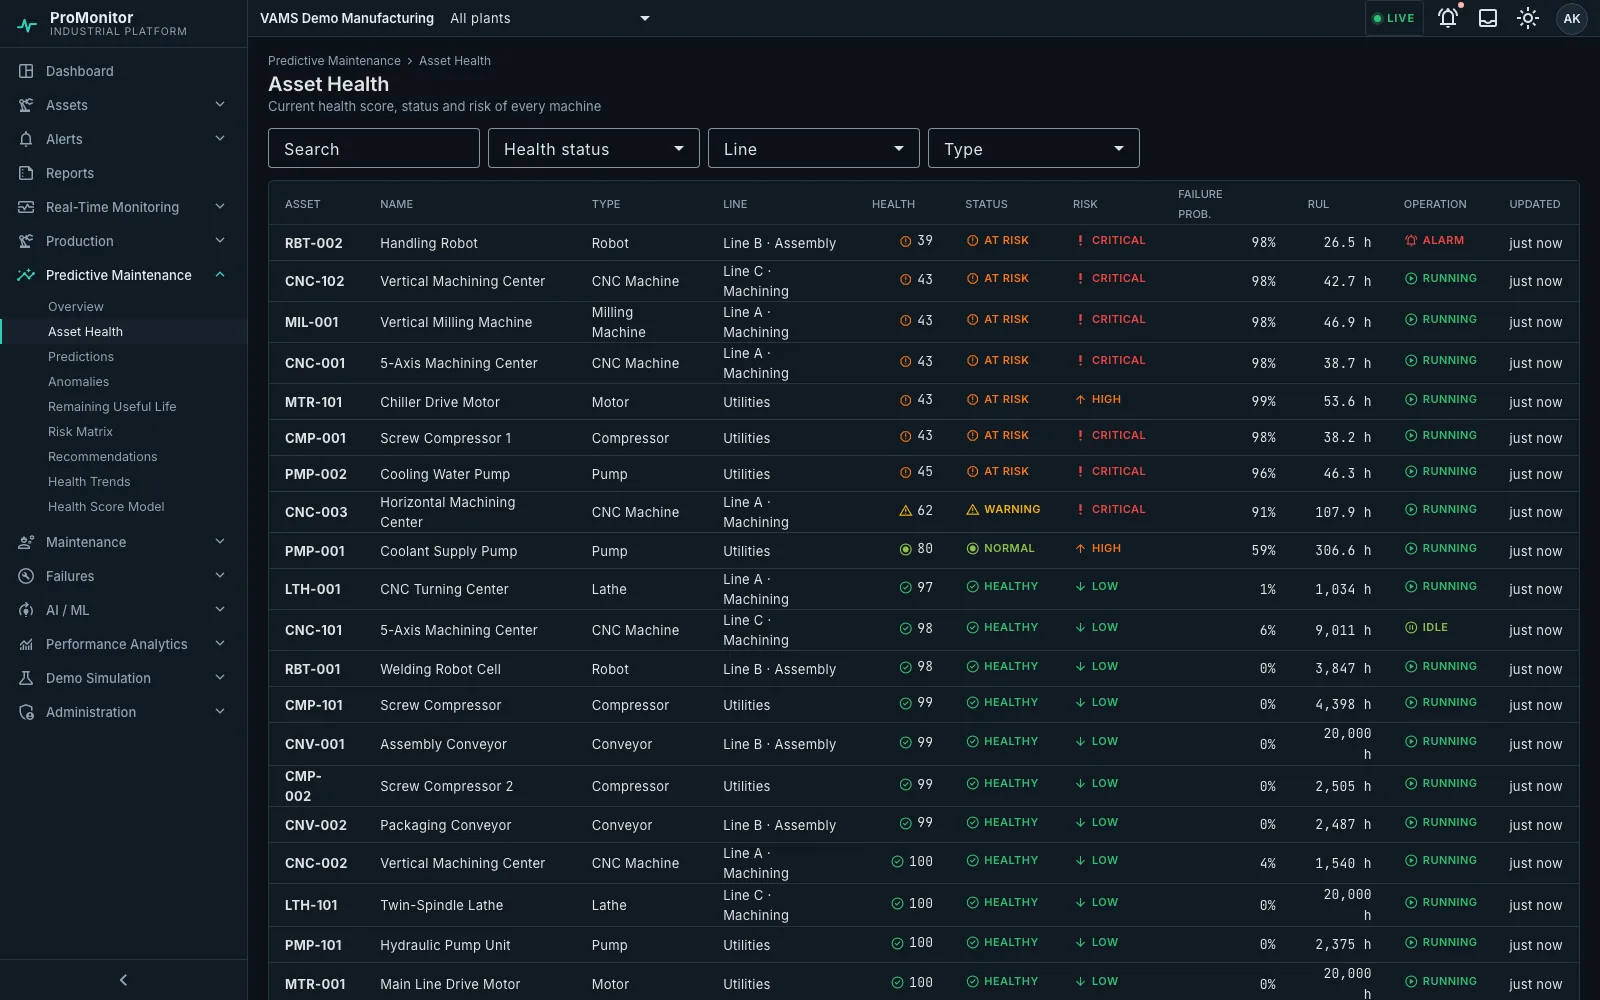
assets/promonitor/pdm-risk-matrix.webp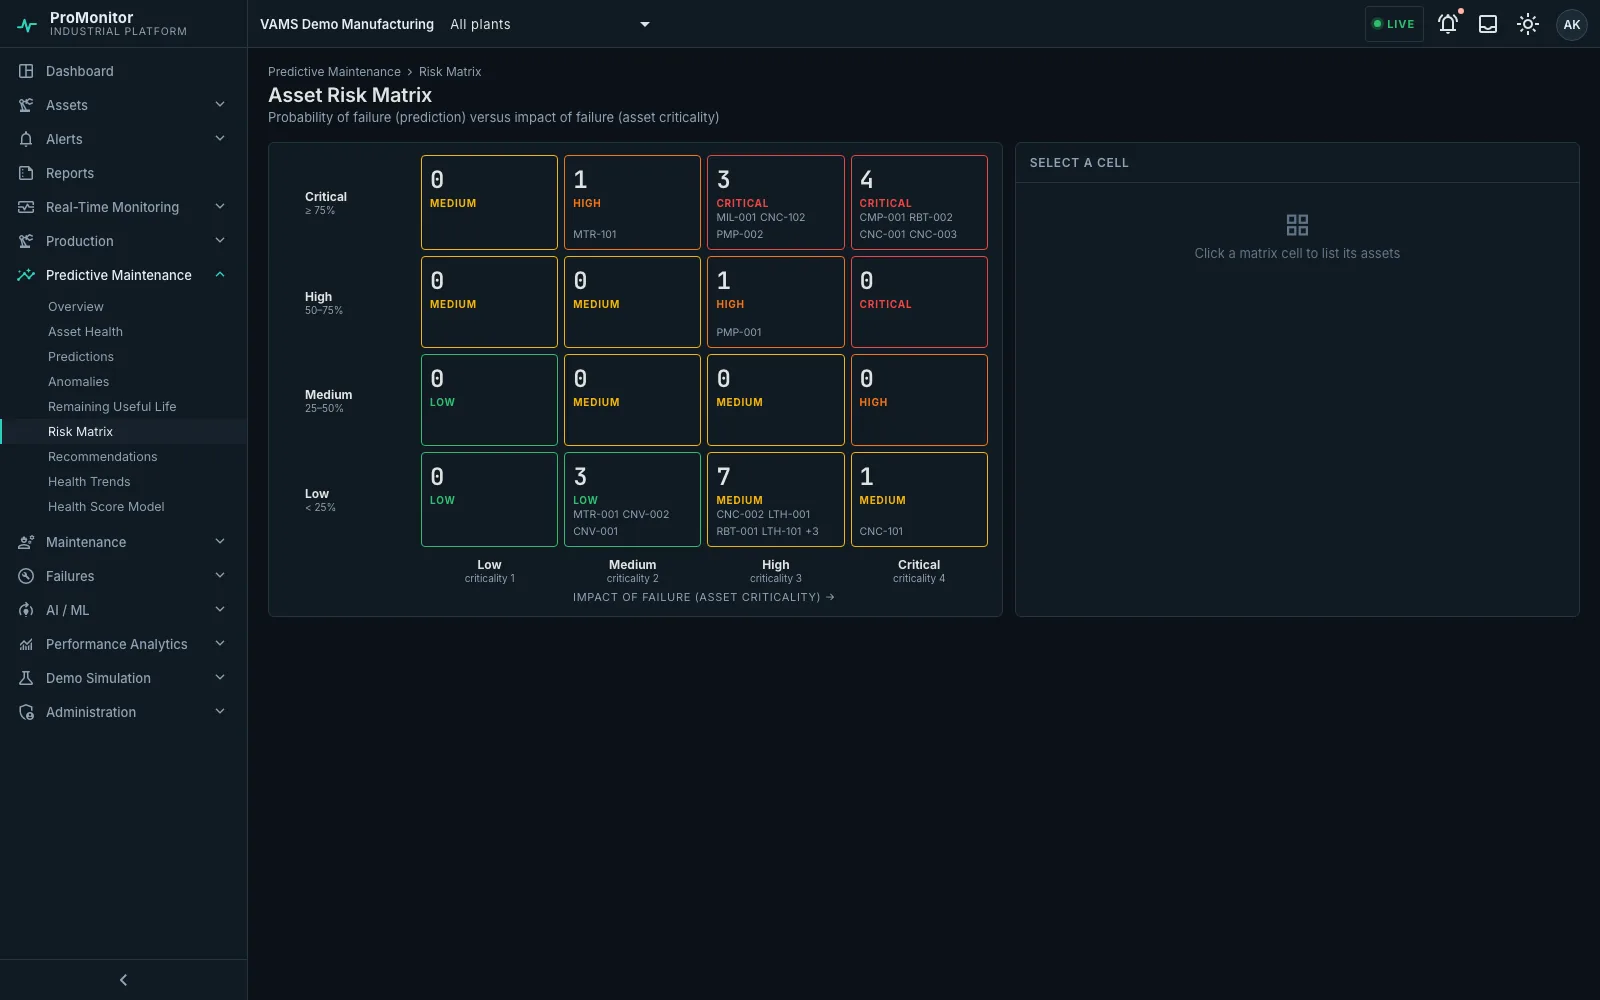
Understand machine and production status as it changes.
Identify unusual machine behaviour before it turns into unplanned downtime.
Compare production against targets during the shift.
Bring data from different machines and protocols into one platform.
Base maintenance and production decisions on what the machines report.
Open protocols for reaching machines and controllers.
A modular service with real-time streaming and background processing.
Relational data, time-series telemetry and a live latest-value cache.
A single-page application with live charts.
Containerised services, deployable in the cloud or on your own site, with an API and a live stream.
Token-based sign-in with role-based permissions and per-application access.
Users and data are scoped to their organization.
Credentials for connected devices are stored encrypted.
Changes are recorded in an audit log that can be exported to CSV.
ProMonitor runs as a set of Docker containers: the API, background workers, the connectivity agent, the machine-learning service and the data stores. Other systems reach it through a REST API and a live WebSocket stream, and a Kafka bridge can feed it existing telemetry.
Which option fits your site — and how it is set up — is planned together with our team.
VAMS Mechatronica has delivered implementations in the railway sector.
VAMS Mechatronica has delivered implementations in the defence sector.
Talk to our team about machine connectivity, Industry 4.0 implementation and ProMonitor.